Two Herdr Mods: GitHub Tasks and Plan Usage
Herdr lets you add native panels to its window with a little JavaScript. I added two, a Tasks panel that starts work from my GitHub project board and a strip showing my Claude and Codex plan usage, and here is how they work and what tripped me up.
I run several coding agents at once in Herdr, a desktop app for terminals and agents. Two questions kept pulling me out of it: what should I work on next? (the answer was on my GitHub project board, in a browser tab) and how much of my Claude plan have I used? (the answer was a /usage command away, in whichever agent I happened to be in).
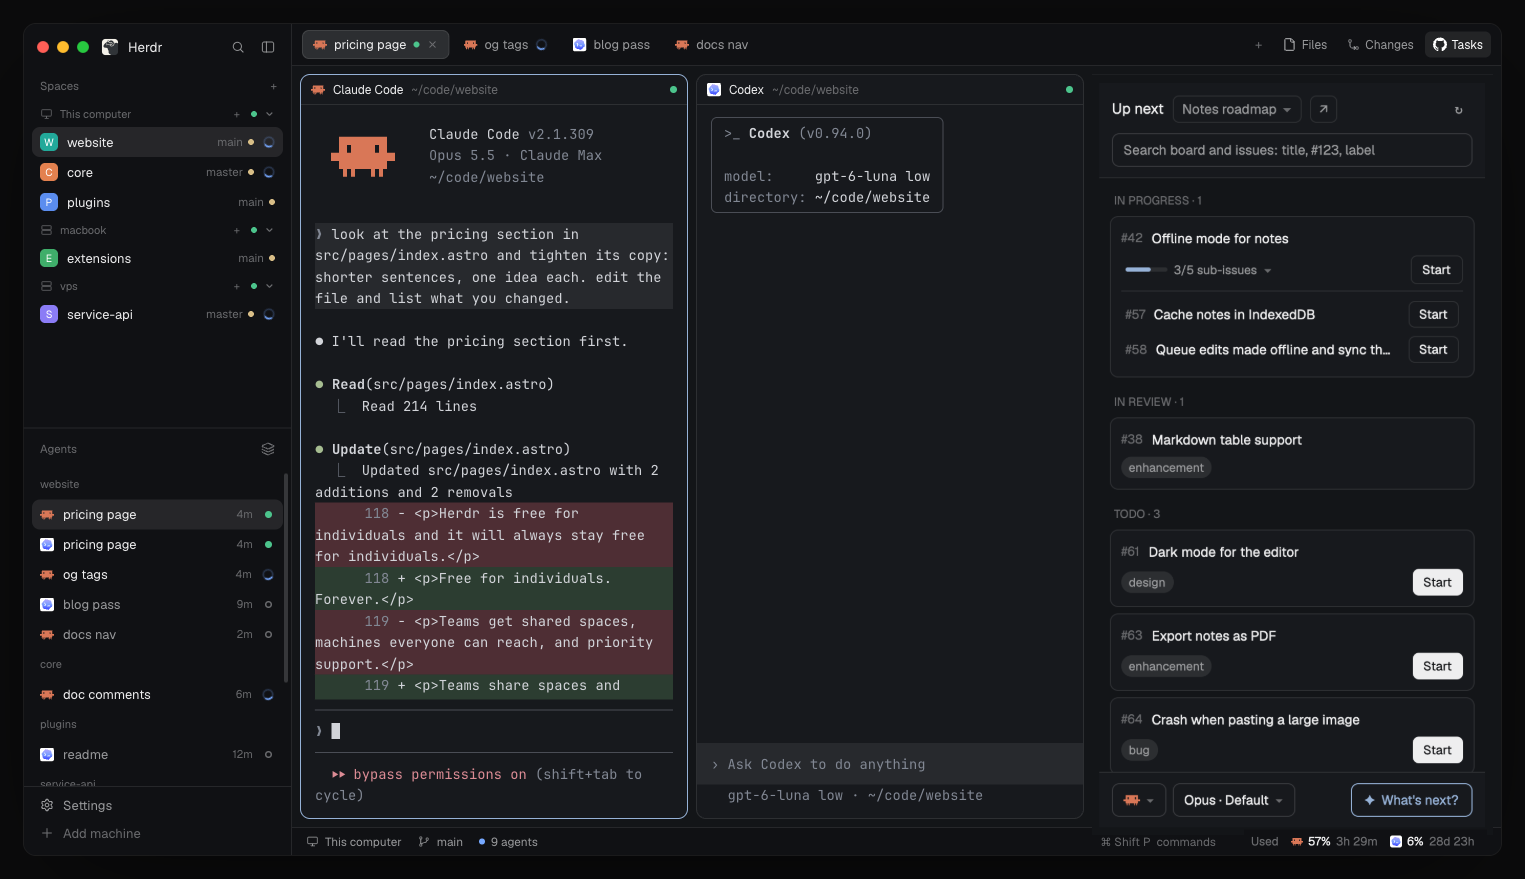
Herdr lets you add your own panels to its window, so I moved both answers into it:
- a Tasks panel beside Files and Changes, showing the board's In Progress, In Review and Todo cards for the repo I'm in, each with a Start button;
- a usage strip at the right of the status bar, showing Claude and Codex plan usage with time to reset.
Both are open source: mbaljeetsingh/herdr-tasks. You can take either one on its own.
What a Herdr mod is
A mod is a folder in ~/.config/herdr-app/mods/ with a main.js and a small mod.json. The JavaScript describes native UI elements (div(), flex, .on_click), and Herdr renders them natively. There is no HTML, CSS or web view. A herdr module gives the mod the app's live data (spaces, tabs, agents, the focused terminal, the theme's colors) and a few ways to act: run an app command, run a program with exec, open a popup.
Saving a file reloads the mod in place, and herdr-app check mods/<name> loads and renders it once and fails with the exact error. Herdr also writes an AGENTS.md into its config folder that explains all of this, so the usual way to build a mod is to ask your agent for one.
Here is the smaller of the two, the usage strip, cut down:
import { View } from "gpui-kit";
import { agents, setShared } from "herdr";

export default class Usage extends View {
  init(_props, cx) {
    cx.timer.every(5 * 60 * 1000, (cx) => this.refresh(cx));
    // An agent finishing a turn is when usage moves: refetch then.
    this.working = new Set();
    cx.timer.every(5000, (cx) => {
      const now = new Set(agents().filter((a) => a.status === "working").map((a) => a.pane));
      // at most every 2 minutes
      if ([...this.working].some((p) => !now.has(p))) this.refresh(cx, 2 * 60 * 1000);
      this.working = now;
    });
  }
  // refresh() fetches and stores the result with setShared("usage.data", …),
  // so the popup opened by a click reads the same numbers.
}
The Tasks panel
The panel watches the focused terminal's repo and picks the project board most of that repo's open issues are on (you can switch boards). It reads the board through gh api graphql and lists every open card by status, in board order. Parent issues show their sub-issue progress ("3/5 sub-issues"), and clicking that lists the sub-issues, each with its own Start.
Start does what I used to do by hand:
git fetch origin mainandgit worktree adda new branch named<issue number>-<slug>offorigin/main;- opens a new space in that worktree with my chosen agent, model and effort, and a first message: "Let's discuss this issue before writing any code:" followed by the issue URL;
- moves the card to In Progress on GitHub.
Because the branch starts with the issue number, the panel can match running agents back to their cards. A card being worked on shows the agent's status ("claude · working", "needs you") and a Go to tab button instead of Start.
Search covers the board and the repo's open issues that aren't on it yet. Anything outside the three columns gets Move to Todo, which adds it to the board first if needed. At the bottom, What's next? opens an agent in the repo with one job: read the board, suggest three or four Backlog items to move to Todo with a reason for each, and change nothing until I agree.
The usage strip

The strip shows "Used", then per agent the session percentage and the time to reset ("57% 3h 29m"). A limit at 70% or more turns yellow, at 90% red. Clicking it opens a popup with a bar for every limit (session, weekly, weekly Opus) and the plan.
The numbers come from local files where possible:
- Codex writes its rate limits into its session logs, so the strip reads the last
rate_limitsrecord from the newest file in~/.codex/sessions. - Claude Code hands its status line a JSON with
rate_limits. A few lines in my status line script save it to a file, and the strip reads that file while it's under 15 minutes old:
if echo "$input" | jq -e '.rate_limits' >/dev/null 2>&1; then
  echo "$input" | jq -c '{at: (now * 1000 | floor), rate_limits}' > ~/.claude/state/rate-limits.json
fi
When that file is stale, it falls back to Anthropic's usage endpoint, signed in with Claude Code's credentials from the macOS Keychain. That endpoint is undocumented and rate-limited, which leads to the first lesson.
What tripped me up
Polling every 30 seconds earned a 429 with a 55-minute Retry-After. My first version asked the usage endpoint twice a minute. Now it fetches every 5 minutes, plus when an agent finishes a turn (which is when usage actually changes) or the popup opens, but never more than once every 2 minutes. A 429 keeps the last numbers and waits out the Retry-After. The status-line file means the endpoint is rarely called at all.
exec leaves stdin open. codex exec and Antigravity's agy wait for input that never comes, forever. Running them through sh -c '… </dev/null' fixed it.
exec stops after 30 seconds. My first What's next? asked an agent for suggestions in one shot and showed them in the panel. Over a whole board, that took about 40 seconds and was cut off. Opening a tab with the agent turned out better anyway: I can argue with its picks.
A mod can't add itself to a panel or a bar yet (herdrdev/herdr-app#520). A mod is placed by the layout, and I didn't want to ship a copy of Herdr's layout that goes stale on the next update. So each mod has a place.json saying where it wants to go:
{ "tabbar": { "size": 84, "props": { "view": "button" } }, "panel": {}, "order": 10 }
and a setup.py that reads your installed main layout and writes a main-mods layout with every installed mod placed. If Herdr moves a node it hooks into, it stops with a message instead of guessing. Re-run it after a Herdr update, or after adding or removing a mod.
Try it
Ask your Herdr agent to add herdr.dev/layouts/mbaljeetsingh/herdr-tasks, or follow the README. It needs gh with the project scope (gh auth refresh -s project). The repo's RECIPE.md describes both mods in enough detail for an agent to rebuild or change them.
Stable .localhost URLs for Every Dev Server (and Every Worktree) with Portless
How I replaced port numbers with stable, named .localhost URLs across all my monorepos using Portless — including a pattern that gives every Claude Code worktree its own dev URL automatically.
What Happened When I Measured My Vision Pipeline
I had been saying "roughly 90% accurate" for months without measuring it. The eval showed that effort and model choice both move the result more than I expected, and that one config scored 59.4%, 59.4% and 90.6% on the same page.